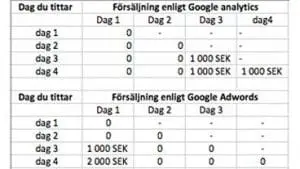
Google Analytics attributes a sale to the day the transaction occurred, while Google Ads attributes a sale to the day the click that led to the sale happened. This results in Google Ads and Google Analytics displaying different data.
Example: On day one, there are two clicks that eventually result in a sale of 1,000 SEK on day three and 1,000 SEK on day four. If you look at the data on day four in Google Analytics, it will show 0 SEK in sales for days one and two, but 1,000 SEK in sales each for days three and four. In contrast, Google Ads will show 2,000 SEK in sales on day one (when the clicks occurred), and 0 SEK in sales on days two, three, and four.
This discrepancy should be kept in mind when interpreting data from Google Analytics and Google Ads.
For instance, a strange phenomenon occurs when you completely stop paying for Google Ads. If you look at Google Analytics for the days immediately after pausing Ads, you may see continued sales attributed to Ads even though you have no budget. This is because the sales are from clicks generated during the last days Ads were active, but the transactions occurred later, after the budget was stopped.
However, looking at Google Ads will give a different picture. From the moment the budget ends, no further sales will be shown. This appears logical. Let’s say you stop the budget on day one and check on day two how much you sold on day one. Suppose it shows 1,000 SEK. Strangely, if you wait until day eleven and check again, it might suddenly show that day one generated 10,000 SEK in sales instead of 1,000 SEK. This happens because sales made between days two and ten from clicks generated on day one are now included. Google Ads tracks clicks for up to 30 days. This means a specific day’s data is only “final” after 30 days, as no further sales will be attributed to that day. For example, if you want to see the total sales generated by Ads on day one, you need to wait about a month.
The fact that Google Analytics and Google Ads display different data is especially important when performing analyses and making account optimizations. Assuming that all sales from Ads remain constant, Analytics will show consistent sales figures for each day, while Ads will show the same sales figures for data older than 30 days (matching Analytics data) but progressively less sales for more recent data. This difference can sometimes lead to incorrect conclusions during optimization. A common scenario involves making a change in Ads that is actually an improvement, then comparing the last 10 days to the previous 10 days. Because days 10–20 have accumulated sales from many more clicks, that period will almost always show better sales than days 1–10.